Case study
Bolt
A weather app that opens on the last two hours of rain moving over you, and treats the fact that five forecast models disagree as the interesting part rather than something to average away.
- Platform
- iOS 17+
- Stack
- SwiftUI · MapKit · Core Image · zero dependencies
- Status
- TestFlight, build 14
- Data
- RainViewer · NASA GIBS · Open-Meteo · CAMS — all keyless
The idea
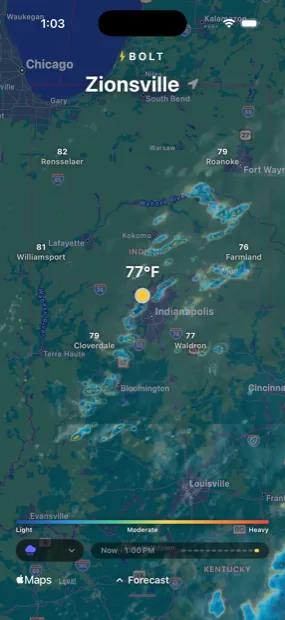
Most weather apps answer “what is the forecast”. The question that actually gets asked, standing in a doorway, is is that rain going to hit me — and the honest answer is a loop of the last two hours of radar, oriented on where you are standing.
So the app opens on the map, already animating, with no chrome to dismiss. The forecast is a drawer you pull up when you want it.
The decision worth defending
Show the disagreement
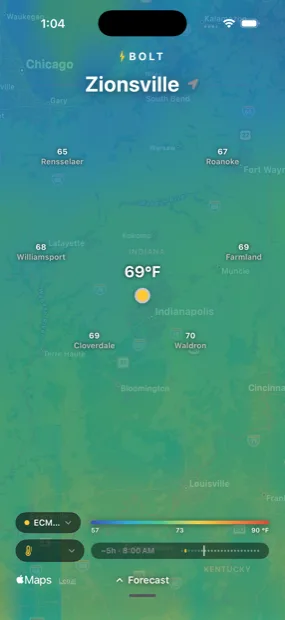
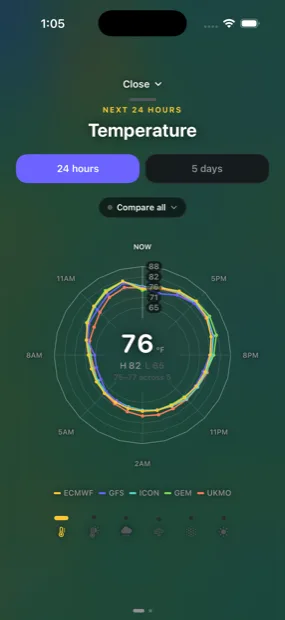
Five global models — ECMWF, GFS, ICON, GEM and UKMO — forecast the same hour differently, and every consumer weather app hides this by picking one or averaging them. Bolt draws all five on a shared domain and puts the spread under the reading.
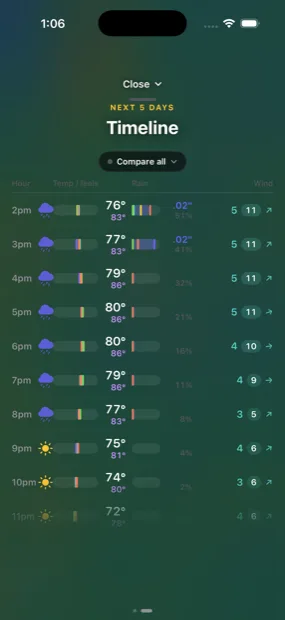
Rainfall is where this stops being an aesthetic choice. Measured on a single afternoon hour, ECMWF forecast 0.03 inches and GFS forecast 0.40 — an order of magnitude apart. An average of those two describes no weather anyone will experience. The band between them does.
Everything is keyless
Radar tiles come from RainViewer, satellite cloud from NASA GIBS, forecasts and air quality from Open-Meteo and CAMS. None of it needs an account, a key, or a billing relationship — so the app has no server, no secrets to rotate, and nothing anyone can switch off.
Lightning is the exception, and it is labelled as such in the code: no free real-time strike feed exists, so strikes are inferred from WMO weather codes on a grid and sized by convective energy. It is a model, not an observation.
What the platform actually does
MapKit, measured rather than assumed
Almost every hard problem here was MapKit behaving in a way nothing reported. It will not request a tile more than one zoom level past maximumZ — silently, zero calls over sixteen seconds. It never calls loadTile when the overlay can build a URL, which quietly killed an entire retry-and-transform layer. It does not stretch a short tile image to fill a declared tile, which produced hard-edged rectangles of cloud that looked exactly like failed downloads.
And MKZoomScale bottoms out at 1/4096, which is why the basemap is vector rather than satellite: a scrim over imagery can only be an overlay renderer, and below that floor no arrangement of one can cover the screen. Coverage measured 1.000 at three degrees of span and 0.078 at a hundred and thirty.
The fix in each case came from instrumenting the thing and reading the numbers, not from reasoning about the documentation.
The shape of it
One screen with a map on it. Six overlays behind a dropdown — storm, temperature, feels-like, wind, air quality, UV — each animating across its own window of time, past through now into forecast. Pull the drawer up and the forecast is either a radar chart or a five-day meteogram, swiped between.
No account, no onboarding, no notifications, no tab bar.
Screens